Charts and Graphs
There are so many great ways to view your data at Fitness Journal. Its very satisfying to enter in workouts, its even more rewarding to evaluate your data over the long term. Here are just a few of the charts, graphs, and reports you will find within your Fitness Journal.
Watch your history change by week, month, and year. Compare how you are doing THIS month VS the same month last year, or the year before that.
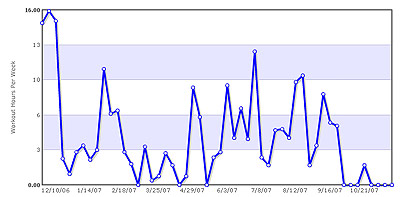 52 Week Charts
Take a look at your workout habits over the last 52 weeks in time, distance, or calories. Are you consistently meeting your weekly exercise goals?
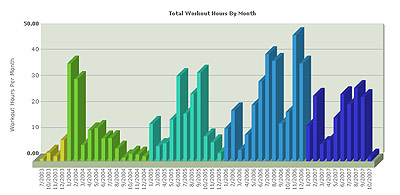 Monthly History
Step back and look at a month by month visual report for your history at Fitness Journal. The more data you have collected, the better. This report will give you a solid overview of your activity level over the long term.
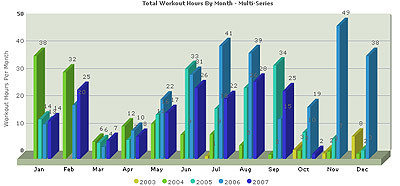 Monthly Multi-Series
We can take the same data and group it by months. This makes it easy to compare monthly data over several years and set new goals for the current month.
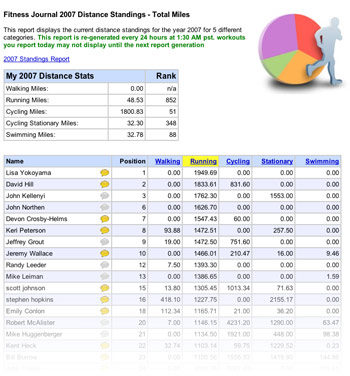 Standings Charts
We here at Fitness Journal are a competitive bunch. After you log your workouts for the day, head over to the charts and graphs section and check out your standings at Fitness Journal. Compare your hours, steps, miles calories. Not enough? Check out our distance standing reports to look at specific distances in sports like running, cycling, swimming and walking.
Custom Workout Reports
We offer the option to run custom date range and activity reports and then export the data into an Excel friendly format to share with your personal trainer or coach. You can also set your coach up with special management tools that allow he or she to monitor your progress, help plan your workouts, and provide you with feedback. See the health and wellness section for more information about management accounts.

|